Vaccination Liberation - Information
Legal: Science: Misc: Searches:
Exemptions
  State_Chapter/
Resource_Contacts

Avoid_Vaccinations
Activism
LegalNews
Introduction
Basic_Facts
Package Inserts
Ingredients of Vaccines
Q_and_A
Artificially Sweetened Times
Membership
Books Videos Tapes
100+ Anti-Vax links
Vax_Cartoons
Breaking News
Planned_Events
KeyWord_Index
Index/Link_Pages
Search_Our_Site
Home_Page
Index_Page
Smallpox Alert!
Is the Flu Vaccine Safe for Toddlers?
Abstract  |   Intro  |   Bias 1  |   Bias 2  |   Bias 3  |   Bias 4  |   Conclusions  |   Financial  |   Notes  |   Graph_1  |   Table_A  |   Graph_2  |   Graph_3  |   Matrix_1  |   Matrix_2  |   References
A critical analysis of a study allegedly proving the safety of influenza vaccines for children 6 months to 23 months of age.
Citation - "Safety of Trivalent Inactivated Influenza Vaccine in Children 6 to 23 Months Old",
10/25/06 JAMA. 2006;296:1990-1997.
Source URLs: PDF  |   Abstract  |   Full Text

Abstract:
Despite the conclusion of the authors of the above study and subsequent JAMA article, the influenza vaccine was NOT proven safe for children under two years of age by the reference study. [1]

The methodology of the study was to compare the number of Medically Attended Events in a group of children in a period after vaccination versus two equal length of time "control" periods for the same group.

Study Flaws include the following:

Introduction:
Beginning in 2004 flu vaccine began to be recommended for all children between 6 and 23 months. There was very little information available about the safety of flu vaccine in this age group. Even worse, the Cochrane Collaboration, an international organization for medical evaluation revealed that "Two efficacy studies involving about 1,000 toddlers indicate that flu shots containing inactivated virus — the only vaccine approved for this age group — are no more effective at preventing the flu than placebo."

Scientific Principles Involved
How does one measure either the adverse effects or benefits of a vaccination?

First one has to define the quantity or quanitities desired to be measured. In this study, the desired quantity was the number of acute (transient) medical events that closely follow vaccination AND which are causally related to the vaccination. Because this figure can not be measured directly, two other quantities will have to be measured first. The desired quantity will be the difference between the two measurements. That is, the vaccine adverse effects will constitute an excess of medical events following vaccination over the expected background of acute events determined by a control period before vaccination.

A risk period is a period of time following vaccination during which medical events are counted

. A control period is a period of time during which medical events are counted but which are known to be unrelated to the vaccination in question. The control gives a reference number of medical events which can be used to predict the background number of medical events in the risk period that are not caused by the vaccination.

The risk of a certain diagnosis of disease occurring after vaccination compared to before vaccination may be listed as a ratio called a Odds Ratio.
Medical diagnosis with a Odds Ratio of less than one means that the diagnosis was less likely to occur after vaccination versus the risk period.
Diagnosis with an Odds Ratio of greater than one means that the diagnosis was more likely to occur after vaccination in the risk period.

I.E. An Odds Ratio of .75 means that a certain diagnosis is only 75 percent as likely to occur in the risk period as in the control period. If diagnosis of a certain disease occurred 100 times in the control period then a .75 risk means only 75 diagnosis occurred in the risk period. Suggesting that the vaccine is not significantly related to this risk and may even be protective.

Medical literature reflects that it is common for some symptoms like fever, cough, redness at vaccine injection site, headaches and sore throat to be more likely to occur after vaccination, that is these incidents have Odds Ratios greater than 1. It is also generally agreed upon, even in the pro-vaccine community, that there is ] NO protective value of flu vaccination for the flu in the two weeks following vaccination. Thus it is unscientific to suggest that the vaccine had a protective effect which lasted only two weeks against 13 diagnosis.

Generally speaking, the number of medically attended events (MAE) in two periods, the control period and the risk period, determine the conclusions for a study. Thus, it is very important to carefully chose the periods and also to do accurate counts of the medically attended events in these two periods. We will see for the JAMA study there there were several risk periods, a common practice, and two control periods, an uncommon practice and clearly incorrect in this case because the second control period was admittedly a risk period.
Problems/Irregularities
An old saying holds that, "Figures do not lie, but liars do figure."
How well did our JAMA study apply the principles we have outlined above?

Let's have you answer that above question by answering a couple more questions

(1) Question: Given the data of the following risk periods, which do you call the Primary Risk Period and the focus of your study.

1. Vaccination Day zero (0) with its high number of medical events, a fact which is admitted but for which the number is unpublished.
2. Days 1-15 after vaccination with approximately 5095 medical events.
3. Days 15-28 after vaccination with approximately 6449 medical events.

(1) Answer: Hold out your hands. If the first thing that comes into your hands is a child, then use the data from all three periods or pick period 3 above for your Primary Risk Period. If the first thing that comes into your hands is a check from Big Pharma, then pick number 2, the study authors chose number 2 and neglected 1 and 3.

(2) Question: Given the data of the two following periods, which do you pick for your Control Period(s).
1. The period of 14 days before vaccination in which children were rejected due to medical events creating a deflated MAE.
2. The period of 14 days in the 15-28 day period before vaccination which, due to population selection, MAE is inflated.
3. The period of 15-28 days after vaccination which has many more medical events than the 1-14 period after vaccination.

(2) Answer: If you are scientifically minded, then you recognize than none of these periods are suitable as a Control Period and you will do the work necessary to generate accurate numbers for a genuine Control Period. On the other hand, in the reference study, the period just before vaccination was rejected for use, and both periods 2 and 3 were used to "predict" the baseline number of medical events in the Primary Risk Period.

It is proper to reject the period just before vaccination due to its artificially low number of MAE, a condition which is created by rejecting for vaccination any child who was sick in this period.

The period 15-28 days after vaccination is not a proper control period but instead is a risk period. We will refer to this as the Secondary Risk Period hereafter for clarity.

The period 15-28 days before vaccination does not contain an accurate count for MAE as shown below in bias sections 2 and 3.


If you have not already done so, it may be best to read the reference JAMA article before trying to digest my comments. Some quotes from the JAMA article follow which sum the JAMA authors' conclusions with some added emphasis:


Design, Setting, and Participants
Retrospective cohort using self-control analysis, with chart review of significant medically attended events at 8 managed care organizations in the United States that comprise the Vaccine Safety Datalink. Participants were all children in the Vaccine Safety Datalink cohort 6 to 23 months old who received trivalent inactivated influenza vaccine between January 1, 1991, and May 31, 2003 (45,356 children with 69,359 vaccinations)."

Results: "... only 1 diagnosis, gastritis/duodenitis, was more likely to occur in the 14 days after trivalent inactivated influenza vaccine."

"Thirteen medically attended events were less likely to occur after trivalent inactivated influenza vaccine, including acute upper respiratory tract infection, asthma, bronchiolitis, and otitis media."

Did you notice the statement that "Thirteen medically attended events were less likely to occur after trivalent inactivated influenza vaccine, including acute upper respiratory tract infection, asthma, bronchiolitis, and otitis media."? [1]

Question: What is the statement, "less likely to occur", based upon?

Answer: Two control periods each had a higher number of medically attended events (MAE) than did the 14 day period which started 24 hours after vaccination.

It should be obvious that the above conclusion is suspicious, to say the least, and calls for a careful examination of the validity of both control periods as well as the correctness of the number of events in the Primary Risk Period.

Question: Note the statement in the above quotes, "Results: "... only 1 diagnosis, gastritis/duodenitis, was more likely to occur in the 14 days after trivalent inactivated influenza vaccine." What does this mean?

Answer: That is a really good question. In the Jama article, in Table 2, eleven diagnosis are listed as follows:

Column marked R/C1 is the Primary Risk Period to Control Period 1 Ratio.
Column marked [R2/C1] is the secondary Risk Period compared to Control Period 1.
ED = Emergency Department
Secondary Risk Period is labeled in the JAMA study as Control Period 2.
Diagnosis                                R/C1   [R2/C1]
Anemia                                   10/3   [8/3]
Convulsions (ED)                         33/15  [27/15]
Gastritis/duodenitis                     11/2   [3/2]
General Symptoms (ED)                     6/2   [4/2]
Lymphadentis                             13/3   [12/3]
Noninfectious gastroentertis (ED)        36/18  [54/18]
Noninfectious gastroentertis (Inpatient) 19/9   [23/9]
Serum reaction                            5/2   [2/2]
Sickle cell anemia                        9/6   [6/1]
Urticaria (rash)                          9/4   [35/4]
Viral enteritis                           4/7   [2/7]
Of the 11 diagnosis above, 10 had less incidence in Control Period 1 than occurred in either the Primary Risk Period or the Secondary Risk Period.

Let us look at a two important statements from the JAMA article,

"Of note, the 3-day risk window in the outpatient setting included days 1 to 3, because inclusion of day 0 (the day of vaccination) has been shown to result in spurious signals when using self-control methods with outpatient data." [This time period was included in analysis of ED and inpatient settings.] In other words, there are a high number of MAE on the day of vaccination leading people to correctly believe that the vaccine is harmful.

the "healthy vaccinee" effect
"Because physicians tend to administer vaccines to healthy children, medically attended event incidence rates in the 1 to 14 days before vaccination may underestimate true background rates (the "healthy vaccinee" effect).27 We therefore excluded days 1 to 14 prior to vaccination from the analysis." In plain language, using the two week period prior to vaccination with its deflated MAE rate as a control period tends to lead one to conclude that the vaccine is harmful. We will discuss the effect of the "healthy vaccinee" effect upon MAE rate calculations later, as well as the fact that using the third and fourth week period prior to vaccination with its inflated MAE rate as a control period tends to lead one to the false conclusions that the vaccine is beneficial and safe.
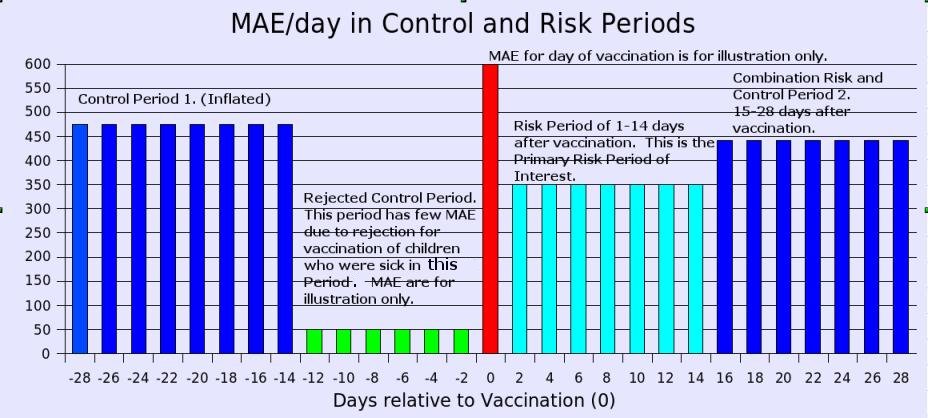
Time line:
Prior Vaccination  Control 1     Rejected   VAX     Risk    Control/Risk
    ????         |   15-28     |  1-14     | 0  |   1-14   |   15-28    |
Risk periods:
0 to 2 days post vaccination
1 to 3 days post vaccination
1 to 14 days post vaccination (primary period of interest)
15-42 days post vaccination (secondary period of interest)
1-42 days post vaccination

Control period 1: 15-28 days prior to vaccination.
Control period 2: 15-28 days after vaccination. Remember, we are labeling this as Secondary Risk Period.

Let's Debunk the validity of Control Period 2 first:
Control period 2: 15-28 days after vaccination:
Hmmm, that's clever, using an undisputed risk period, 15-28 days after vaccination to constitute a "control period" for predicting the number of MAE in the early risk period of 1-14 days after vaccination.

It may be clever to use a control period within the longer risk period, but scientifically valid it is NOT! At least, it is not valid for calculating what the MAE rate in the first major risk period should be.
Until you actually measure the number of MAE in these two periods you can not predict if the number of MAE in the period immediately following vaccination either should or will be less or more than the number of MAE in the next risk period two weeks later.

If the MAE incidence in this Secondary Risk Period had been lower than the Primary Risk period, would it be a valid control period for the purpose of estimating MAE incidence in the Primary Risk period? NO, of course not. Such an occurrence would simply tell us the obvious, that vaccine adverse effects were greater in the Primary Risk Period. However, in the JAMA study, the MAE incidence was higher in the Secondary Risk Period versus the Primary Risk Period, and this likewise does not allow us to calculate the extent of vaccine adverse side effects in the Primary Risk Period. However, the fact that these risk periods close to the vaccination date had differing MAE rates only tell us which risk period had the most vaccine side effects but without a valid control it can not be known what the magnitude of side effects alone are in either period.

Actually, many people would probably guess that the number of MAE in the two weeks immediately following vaccination will be higher than in the next following two weeks. However, this was not the case in this study.
What does this tell us?
Was the vaccine protective for the first two weeks following vaccination?
Or, did the symptoms of vaccine harm increase 3 and 4 weeks following vaccination versus the first two weeks?

Only a few people will buy that a vaccine is "protective" for the first two weeks following vaccination after which the "protection" immediately falls to near zero. In the first two week period following vaccination children commonly experience more fevers and even Influenza Like Illness (ILI). Chronic illness due to vaccination takes longer to emerge.

Given that the flu vaccine administered in the years covered by this study contained mercury, a substance difficult to excrete for some children, and also contained aluminum a substance bonded to the vaccines' antigens for the purpose of making the antigens difficult to eliminate by all individuals, it perhaps should come as no surprise that the number of MAE should rise in the second two week period after vaccination.

We conclude that the harm of the vaccine does not end at 2 weeks but continues to increase in strength.
Debunking the published MAE rates for Control Period 1
For a clear picture of the published, but uncorrected and thus incorrect, MAE rates in the Control Period 1 as well as the risk periods see graph 1 immediately below and for some of the actual numbers of MAE incidence see table 1 lower on this page.
Graph 1:
Abstract  |   Intro  |   Bias 1  |   Bias 2  |   Bias 3  |   Bias 4  |   Conclusions  |   Financial  |   Notes  |   Graph_1  |   Table_A  |   Graph_2  |   Graph_3  |   Matrix_1  |   Matrix_2  |   References

Table A: Medically Attended Events
Published data from Table 1, JAMA [1] Calculated data derived from published data.&
Diagnosis MAE Mean of Control 1 & 2 Odds Ratio, Risk to Control 1 Odds Ratio, Risk to Control 2 MAE Control 1, 15-28 days before vaccination. MAE Risk Period 1-14 days after vaccination. MAE Control/Risk 15-28 days after Vaccination
Acute Upper Res. Track Inf. 2340 .74 .81 2446 1810 2234
Otitis Media 1958 .77 .76 1945 1498 1971
Asthma 912 .69 .80 979 676 845
Dyspnea 338 .67 .87 382 256 294
Cough 202 .67 .84 225 151 179
Pneumonia 190 .82 .82 190 156 190
Acute Bronchiolitis 179 .74 .79 184 136 174
Other Atopic Dermatitis 156 .76 .75 155 118 157
Dermatitis 141 .77 .70 134 103 148
Totals: For above diagnosis only. 6416 + 95 * = 6511
[INFLATED]
? ? 6640 + 83 = 6723
[INFLATED] *
4904 + 50 = 4954 6192 + 81 = 6273 *
* Note: Five more Diagnosis with their Mean MAE are listed in the original table but the MAE incidence range is from 8 to 33 and so these MAE for 5 diagnosis are not listed on individual lines.

& Table 1 of reference JAMA study: [1]
Calculated data from Table 2, JAMA [1] ^
Totals for Table 2. [1] --- ? ? 66 141 176
Totals: Table 1 + Table 2 --- ? ? 6723+66
----------
6789
4954+141
----------
5095
6273+176
----------
6449
Note: the totals for Table 2 have a "normal" look to their distribution:
66 for Control Period 1.
141 for the first (Primary) Risk Period.
176 for the second Risk Period.
A discussion of four theoretical errors affecting the ratio of
Vaccine Adverse Effects versus Background (Baseline) MAE
Are the published figures for Control Period 1 grossly inflated?

Do published figures for the Primary Risk Period suffer serious deflation by ignoring the day of vaccination?

Or both?
If one wanted to do a fair study, some obvious changes in protocol would have to be made:
Bias #1. Control Period inside of a Previous Risk Period.
Keep in mind this study deals with a population of children in the 6-23 month age bracket with its intense vaccination schedule.

The risk of side effects from vaccination do not fall immediately to zero following the first two week risk period after previous vaccinations.

Some of the children for the control group for receiving the flu vaccination had another vaccination in the 60 days prior to the flu vaccination. This fact places Control period 1 into the 42 day risk period for vaccine induced events for some portion of the children.

And if the risk period of previous vaccines is extended in time, which in truth it must be, then virtually all children would have some degree of increased MAE incidence in both the Control Period 1 as well as the Primary Risk Period following the flu vaccination. Because this Primary Risk Period is one month later in time than Control Period 1, it can be assumed that previous vaccination(s) will contribute more MAE incidence to Control Period 1 than will be contributed to the Primary Risk Period for the flu vaccination.

For examples of this decline in MAE see Graph 2 below which plots two different rates of decline with two different starting points..

It is the difference in magnitude of this bias between the control period prior to vaccination and the risk periods following vaccination that we are concerned with here. Even if this factor is one percent or less, it should be taken into account.
Graph 2.

Graph above shows two Hypothetical declines in the contribution to the total of Medically Attended Events made by a previous vaccine.

The red bars show the decline in the contribution to the total MAE made by vaccines where the beginning example starts at 30 percent of the total MAE and declines weekly at the rate of 10% of its own contribution. (I.E. 10 % of 30 % = 3 % of overall total per week.) [This type of decline is similar to compounding interest calculations, only in reverse, whereby the risk caused by previous vaccinations never fully declines to zero.]
Between 3 weeks prior to vaccination which is the center of the 15-28 days Control Period 1 - and - 1 week after vaccination which is the center of the Primary Risk Period there would be a 7.5 percent reduction in total MAE.

This may be on the high end of probabilities.

The purple bars illustrate an contribution of vaccine side effects which begins at 10 % of the total MAE at 6 weeks prior to vaccination and declines at a rate of 5 % per week of its own contribution. (I.E. 5 % of 10 % = .5 % of overall total/week.)
Between 3 weeks prior to vaccination which is the center of Control Period 1 and 1 week after vaccination which is the center of the Primary Risk Period there would be a 1.6 percent reduction in total MAE.

This second example of hypothetical decline may be closer than our first example to a typical change in MAE in the 28 days between the center of Control Period 1 and the center of the Primary Risk Period.

The true difference in rate of contribution of the side effects from a previous vaccination between the Control Period and the Primary Risk Period must be taken into effect when calculating expected MAE in the Primary Risk Period.


Upper and lower limits of 1.6 and 7.5 percent is only a suggested range of needed correction to baseline MAE. In the JAMA study this correction is between a minimum of 1.6 % of 6789 = 109 and 7.5 % of 6789 = 509.

This is only the first correction to our MAE which will be used to estimate background MAE incidence in the Primary and Secondary Risk Periods.
                Min.   Max. correction
Starting MAE   6789    6789   
Correction one -109    -509
---------------------------
Result         6680 to 6280


Bias #2, the "healthy vaccinee" effect: A population selection bias.


Imagine a hypothetical population of children:
1 % are totally unvaccinated and have perhaps 1 MAE per year.
12 % have frequent acute illness or chronic illness and have perhaps 12 MAE per year.
20 % have single parents working two jobs and the children's average health is such they have 4 MAE per year.
67 % have "average health" and this group has about 3 MAE, on average, per year.

The children whose parents have the time and interest to have their child vaccinated with a vaccine which is not yet recommended will mostly come from our last population. [the 67 %]

The 3 MAE per year for this population is for purposes of illustration such that, on average, 1 child in 8 will have a MAE every 2 weeks.

Matrix to illustrate the rejection of all children who have a MAE in the two weeks prior to vaccination.
A1 B1 C1 D1 E1 F1 G1 H1
A2 B2 C2 D2 E2 F2 G2 H2
A3 B3 C3 D3 E3 F3 G3 H3
A4 B4 C4 D4 E4 F4 G4 H4
A5 B5 C5 D5 E5 F5 G5 H5
A6 B6 C6 D6 E6 F6 G6 H6
A7 B7 C7 D7 E7 F7 G7 H7
A8 B8 C8 D8 E8 F8 G8 H8


When we select a portion of this population for our vaccine trial, we reject all (or nearly all) the children who were sick in the 2 weeks prior to the vaccination date. Mentally remove all the children from Column H in the matrix above. The remaining population in our selection is now 7/8 of its size two weeks earlier but still retains all of the children who were sick in the 15-28 day Control Period 1 and these children now constitute 1 child in 7 instead of the previous 1 in 8 ratio which was our starting or true MAE/Period ratio. Is this significant? Yes, this action inflates the MAE rate from 1/8 (12.5 %) to 1/7 (14.3 %) of the total reference population.

To better visualize this, refer to graph 3 above. Note that the right hand section of the graph, under period "H" has a large "X" at the bottom indicating that most of the 6800 children, possibly all, are removed from the vaccine trial. This is one-eighth of our starting example population. Of importance is the fact that nearly all the children who had an MAE in period "G", the Control Period 1, are still part of the remaining population.

Let us say for sake of illustration, one that closely parallels our JAMA study, that the number of children who have an MAE every 2 weeks is 6789, approximately what was published for Table 1 plus Table 2 of the JAMA study.[1] However, this 6789 is for a larger population (8/8) and reducing the population by 1 in 8 children requires an equal percentage reduction of 12.5%, for this control group which has become 7/8 of the original population.

(12.5% of 6789 = 849 for the second correction to our MAE.)
These figures are for illustration only. Some population, say 52,000 was reduced to 45,356 for the first flu vaccination. This population of 45,356 was further reduced to 24,003 for the second round of flu vaccinations. Some portion of the second reduction in population was due to children aging above 23 months and another part was due to MAE in the two weeks prior to the second vaccination. Because the relative contributions of age and MAE in the two weeks prior to the second vaccination are not published, no attempt will be made to refine this calculation. There is a wide margin for error. The true figure for the combined vaccination schedule could be less than 10 to over 25 percent.
                Min.   Max. correction
Starting MAE   6789   6789
Correction one -109   -509
Correction two -840   -840
--------------------------
Result         5840 to 5440

We have two more reductions to the MAE in Control Period 1 which for calculation purposes needs to be made.


Bias #3, the second "healthy vaccinee" effect:

The bias of removing the children who had an MAE in the two weeks prior to vaccination does not end with simply inflating the relative number of MAE compared to the population size. The 1 in 8 children with an MAE each two week period is simply an average. Even in this relatively healthy population, some children will seldom have an MAE and others will have relatively frequent MAE. For sake of illustration, let us say that 10 percent of the children will contribute 33.3 percent of the total MAE.

Matrix to illustrate that rejection of the children shown in column H, as H8 had a relatively large effect on total risk of the remaining group.
A1 B1 C1 D1 E1 F1 G1 H1
A2 B2 C2 D2 E2 F2 G2 H2
A3 B3 C3 D3 E3 F3 G3 H3
A4 B4 C4 D4 E4 F4 G4 H4
A5 B5 C5 D5 E5 F5 G5 H5
A6 B6 C6 D6 E6 F6 G6 H6
A7 B7 C7 D7 E7 F7 G7 H7
A8 B8 C8 D8 E8 F8 G8 H8


In other words, 10 % of the children will have one MAE per each 3 periods (total of 6 weeks) while the other 90% of the children will thus have less than 1 MAE per 8 periods. Since one-third of these high risk children will have one MAE in in any 2 week period, including the period immediately prior to vaccination, this means that fully one-third of these high risk children are eliminated from our control group. This fact causes a need to reduce by an additional 11.1% (one third of 33.3%) the number of MAE expected to occur in any two week period following this population reduction. Eleven point one percent of our base of 6789 is 754.
                 Min.   Max. correction
Starting MAE     6789   6789
Correction one   -109   -509
Correction two   -840   -840
Correction three -754   -754
----------------------------
Result           5086   4686 

This is the last adjustment to the control period baseline which we will make. However, there is another correction to be made to the Primary Risk Period figures.

Warning:
It should be noted that bias 2 and 3 likely interact in a way that reduces the amount of total error of bias 2 plus bias 3 to be less than illustrated in the two combined examples. However, corrections for bias 2 and 3 need to be made to achieve an accurate baseline control MAE figure even if a more complex formula must be used and of course using real data. None the less, the above example illustrates the principle.


Bias #4, neglecting day zero (0):

The day of vaccination is not included in the published study for the obvious reason that there will be a high rate of MAE incidence on this date. This high incidence of MAE on this date due to the stress of vaccination likely lowers the number of MAE for a few following days by triggering events which were already in the making. The Day 0 MAE must be taken into account in order to have an accurate number of MAE for the Primary Risk Period. See Graph 1 and note the large spike of MAE incidence in Day zero (0). This is for illustration only as the actual rate for Day 0 of this trial was not published.

Let us assume for sake of illustration that the incidence rate on this day is only twice as high as for the days 1-14. The 5095 MAE in days 1-14 divided by 14 gives a figure of 364 per day. If we use this estimate for the MAE on day zero by multiplying by two we get 728.

See Graph 1 and imagine we create an Adjusted Primary Risk Period using days 0-13 after vaccination instead of 1-14. Since our example has on the first day twice the incidence of the average for this period, another 364 must be added to the total of the MAE for this Adjusted Risk Period.
                  Min.   Max. 
Control Period 1.             Primary Risk Period
Starting MAE     6789   6789   |Starting MAE          5095
Correction one   -109   -509   |Estimated Correction + 364
Correction two   -840   -840   |
Correction three -754   -754   |
----------------------------   | ----------------------------
Result           5086   4686   |Adjusted Total        5459

Estimated (using the LARGER of our Control Period 1 estimates.)
excess MAE in Adjusted Primary Risk Period  is 5459-5086 =  373 
Estimated (using the SMALLER of our Control Period 1 estimates.)
excess MAE in Secondary Risk Period  (15-28) is 6449-5086 = 1363

The Odds Ratio for 5459/5086 is 1.07 and the Odds Ratio for 6449/5086 is 1.27.
These Odds Ratios for the risk of flu vaccination shown above are much more likely to be within range of true values than the published Odds Ratios of less than 1 for risk of vaccination.

Adjusted Risk Period (0-13) with 5459 MAE estimated is 373 greater than estimated 5086 MAE for background incidence rate.
Risk period 15-28 days after vaccination with 6449 MAE is greater by 1363 than estimated 5086 MAE for estimated background incidence.


    Neglected/incorrect factors in the JAMA calculations:
  • Population selection bias upon the Control Period 1.
  • Choosing the risk period with the least number of MAE.
  • Using a risk period as a control period.
  • Neglect of Day 0 in risk period.
it is clear that These two comparisons are much more likely to be true than the published Odds Ratios.

I have tried to keep the suggestions in these illustrations above within the bounds of reason.
My illustrated adjustments shown above may not be accurate but they are sound in principle and demonstrate that
the published Odds Ratios for this vaccine can not be correct as stated in the JAMA article. [1]


The value of Control Period 1 as published is misleading for determining how many MAE should be in the Primary Risk Period as a background to calculate how many MAE were due to the vaccine and how many MAE were due to expected background incidence.
    Conclusions:
  • Control Period 1 suffers from multiple inflating influences.

  • The Secondary Risk Period falsely labeled as Control Period 2 is not valid for estimating a baseline MAE incidence to compare to the Primary Risk Period.

  • The Control Period 2 in this study is not only a "secondary" risk period, but as the MAE incidence in this period is 27 % higher than in the Primary Risk Period, this study should have used this risk period as the Primary.

  • Figures for the Primary Risk Period are significantly deflated by ignoring the Medically Attended Events which occur on the day of vaccination.

  • The reference study which claims that the influenza vaccine proved to be safe is not correct and needs to be done again. The methodology of this study is clearly not valid. [1]


Abstract  |   Intro  |   Bias 1  |   Bias 2  |   Bias 3  |   Bias 4  |   Conclusions  |   Financial  |   Notes  |   Graph_1  |   Table_A  |   Graph_2  |   Graph_3  |   Matrix_1  |   Matrix_2  |   References
Author Affiliations:

Clinical Research Unit, Kaiser Permanente Colorado (Drs Hambidge, Glanz, France, McClure, Xu, and Yamasaki),

Community Health Services, Denver Health,
and Department of Pediatrics, University of Colorado School of Medicine (Dr Hambidge),

and Department of Preventive Medicine and Biostatistics,
University of Colorado School of Medicine (Drs Hambidge, Glanz, and France),

Denver; Center for Health Studies,
Group Health Cooperative, Seattle, Wash (Dr Jackson);

Center for Health Research, Northwest Kaiser Permanente, Portland, Ore (Dr Mullooly);

UCLA Center for Vaccine Research,
Los Angeles Biomedical Research Institute at Harbor-UCLA Medical Center, Calif (Dr Zangwill);

Southern California Kaiser Permanente, Panorama City (Dr Marcy);

Kaiser Permanente Vaccine Study Center, Northern California Kaiser Permanente,
Oakland (Dr Black and Mr Lewis);

University of California, San Francisco (Dr Shinefield);

Marshfield Clinic Research Foundation, Marshfield, Wis (Dr Belongia);

Health Partners Research Foundation, Minneapolis, Minn (Dr Nordin);

Centers for Disease Control and Prevention, Atlanta, Ga (Drs Chen, Shay, Davis, and DeStefano).


Financial Disclosures: [2]

Dr France reports having received vaccine study funding from Sanofi Pasteur and MedImmune.

Dr Yamasaki reports being a coinves- tigator in clinical trials for MedImmune (FluMist) and Adventis (Tdap).

Dr Jackson reports having received grant support from GlaxoSmithKline, having received grant support from and working as a consul- tant for Sanofi Pasteur and Chiron (now Novartis), and serving on the speakers’ bureau for Sanofi Pasteur.

Drs Mullooly and Nordin report having received grant support from Sanofi Pasteur.

Dr Marcy reports working as a consultant for Sanofi Pasteur, Merck, GlaxoSmithKline, MedImmune, and Abbott and serving on the speakers’ bureau for Sanofi Pasteur and GlaxoSmithKline.

Dr Black and Mr Lewis report having received grant support from Sanofi Pasteur, Chiron, and MedImmune.

Dr Shinefield reports having received grant support from and serving on the speakers’ bureau for Sanofi Pasteur.

The authors report that there was no industry involvement in any aspect of this study. The other authors report no financial disclosures.

According to http://www.medscape.com/viewarticle/546470
"The Centers for Disease Control and Prevention (CDC) supported this study through America's Health Insurance Plans. Some of the authors have disclosed various relevant financial relationships with Sanofi Pasteur, MedImmune, Adventis, GlaxoSmithKline, Chiron (now Novartis), Merck, and/or Abbott."
  • Affiliations with seven pharmaceutical companies.
  • CDC has a $2.1 Billion per year budget for the promotion of Vaccines.
  • Insurance companies.


Abstract  |   Intro  |   Bias 1  |   Bias 2  |   Bias 3  |   Bias 4  |   Conclusions  |   Financial  |   Notes  |   Graph_1  |   Table_A  |   Graph_2  |   Graph_3  |   Matrix_1  |   Matrix_2  |   References
Notes:
Flu Shots for Toddlers Not Backed By Evidence, Major Study Says http://www.cfah.org/hbns/getDocument.cfm?documentID=1211

Only a few studies of the vaccine have been conducted in children under 2 years old, and findings suggest that the injection is no better than a placebo at preventing influenza. Moreover, only one tiny study has looked specifically at the safety of flu shots in toddlers.

The Cochrane review [The Cochrane Collaboration, an international organization that evaluates medical research.] comprised 51 studies of influenza vaccines — including 17 papers translated from Russian for the first time — involving more than 250,000 healthy youngsters under age 16.

Yet only a fraction of these studies focused on children younger than 2. Two efficacy studies involving about 1,000 toddlers indicate that flu shots containing inactivated virus — the only vaccine approved for this age group — are no more effective at preventing the flu than placebo.


Abstract  |   Intro  |   Bias 1  |   Bias 2  |   Bias 3  |   Bias 4  |   Conclusions  |   Financial  |   Notes  |   Graph_1  |   Table_A  |   Graph_2  |   Graph_3  |   Matrix_1  |   Matrix_2  |   References
References:
[1] "Safety of Trivalent Inactivated Influenza Vaccine in Children 6 to 23 Months Old"
Citation_date="10/25/2006" JAMA. 2006;296:1990-1997.

Source URLs: PDF  |   Abstract  |   Full Text

[2] Alternate source for downloading this article:
PDF file: http://www.putchildrenfirst.org/media/jama.pdf